What is Format Painter, Why Use It, and How to Use Format Painter in PPT?
Format Painter is a feature in PowerPoint that lets you quickly copy the formatting (not content) of one object and apply it to another. It’s found in the Home tab as a small paintbrush icon. You can use it to replicate font styles, colors, shapes, borders, and more, ensuring consistent slide design.
Table of Contents
How do you copy formatting just once?
To copy formatting one time:
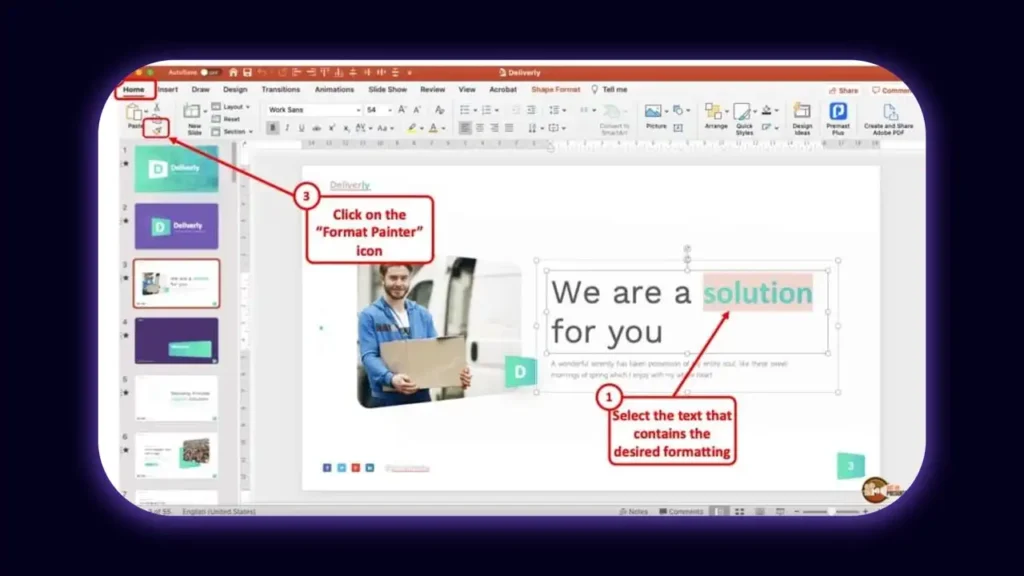
- Select the object or text that you want to format.
- Click the Format Painter icon once.
- Your cursor changes to a paintbrush.
- Click or drag over the target object or text to apply the formatting.
Once used, Format Painter deactivates automatically. Press Esc to cancel at any point.
How do you apply formatting multiple times?
To apply formatting repeatedly:
- Select the object with the formatting.
- Double-click the Format Painter icon.
- Click multiple targets across your slide deck.
- Press Esc or click Format Painter again to deactivate.
This locked mode is perfect when updating multiple slides with the same design elements.
What can Format Painter transfer?
Format Painter works across many PowerPoint elements:
- Text: Font, size, color, bold/italic, alignment, line spacing, indentation.
- Shapes: Fill color, outlines, shadows, glows, 3D effects.
- Images: Picture borders, shadows, or visual style presets.
- Charts and SmartArt: Certain visual themes and layout styles (limited).
- Icons: Fill color and outline.
What are Format Painter’s limitations?
While powerful, Format Painter has constraints:
- Table formatting is not fully transferable. Borders, shading, row height, and column width won’t be copied, only the text formatting inside cells.
- Object size and position are excluded.
- Animations can’t be copied, use Animation Painter instead.
- Grouped objects may behave inconsistently.
- Mixed formatting within a text box is simplified; usually only the first character’s style is applied across the target.
Pro tip: If Format Painter doesn’t meet your needs, consider using a third-party tool or alternate method.
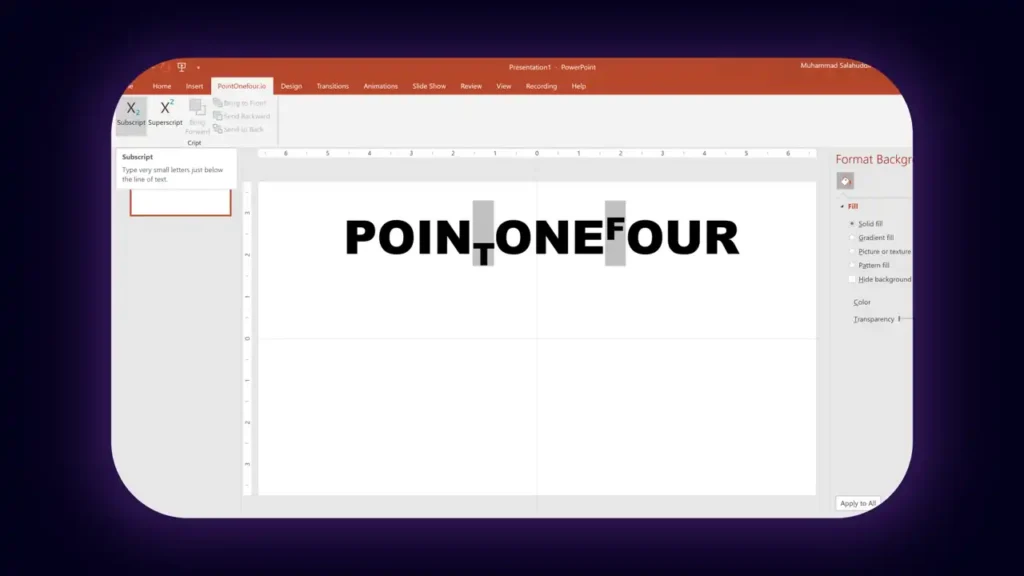
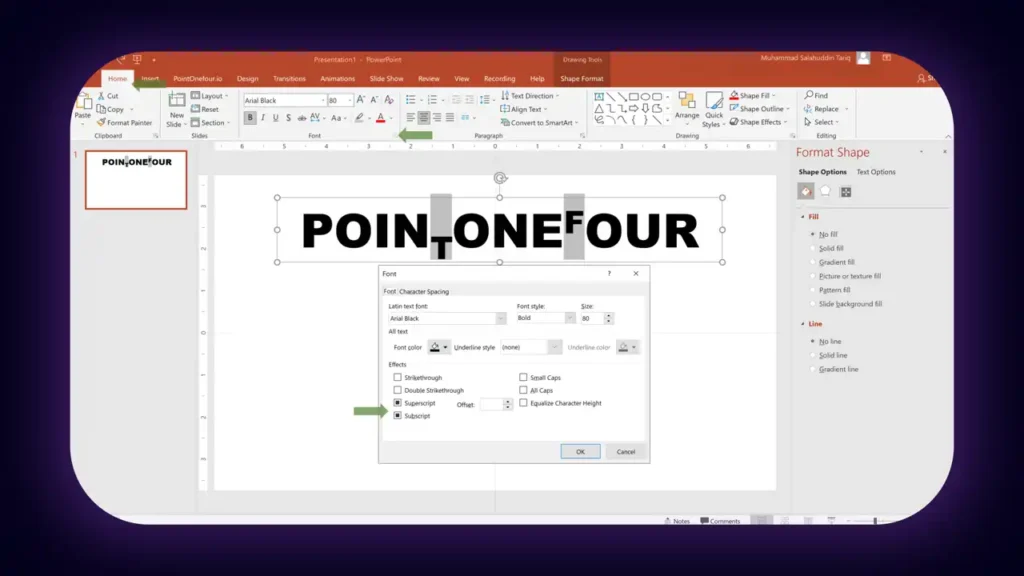
Learn How to Add a Superscript in PowerPoint
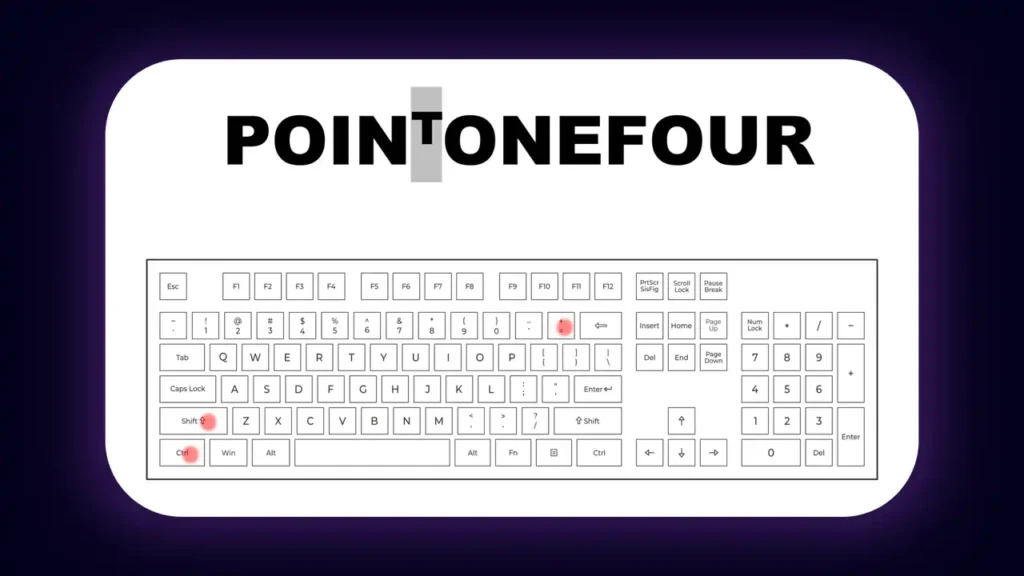
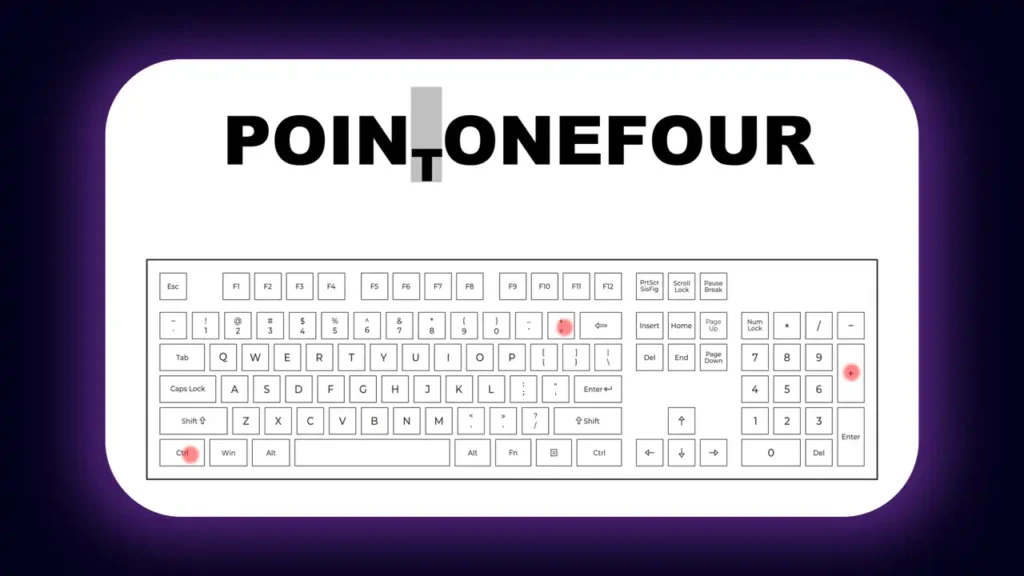
What keyboard shortcuts for Format Painter can you use?
PowerPoint supports Format Painter functionality with keyboard shortcuts:
- Ctrl + Shift + C: Copy formatting.
- Ctrl + Shift + V: Paste formatting.
This method works well when you want to copy format between non-contiguous slides or even separate PowerPoint files.
How can you overcome limitations in copying formats?
Here are three workarounds:
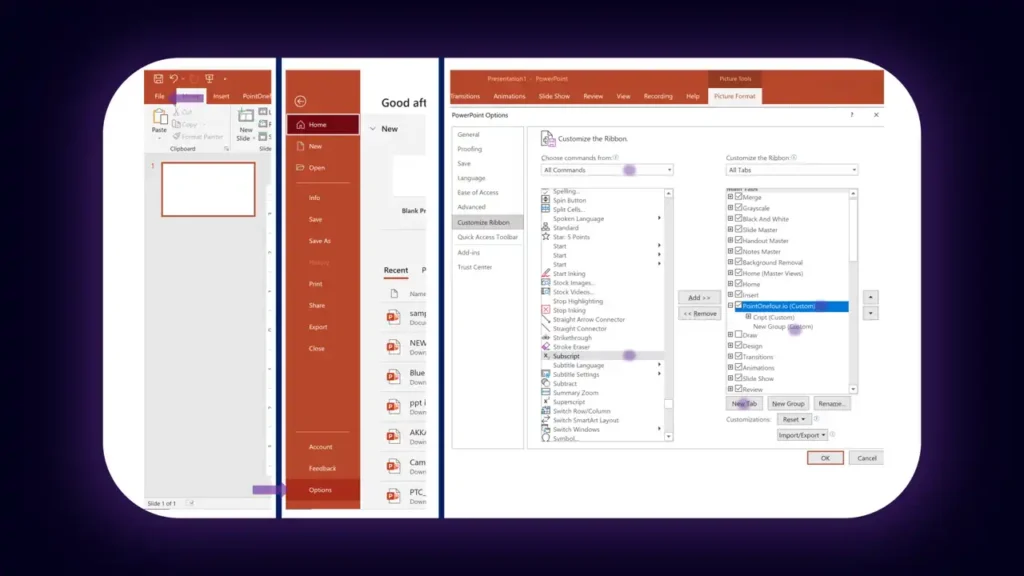
1. Use professional PowerPoint add-ins
Add-ins like PPT Productivity offer:
- Table Format Painter
- Size & Position Painter
- Advanced Painter (copy only fill, only outline, etc.)
- Animation transfer tools
These tools handle features that the built-in Format Painter skips over.
2. Create and reuse master slides or templates
If working with complex elements like styled tables or SmartArt, design them once in a master slide and duplicate the slide whenever needed.
3. Round-trip through Excel or Word for tables
Format the table in Excel where styling tools are stronger, then copy it into PowerPoint with “Keep Source Formatting.”
For a custom-designed PowerPoint presentation or a complete redesign, contact us here or visit our Fiverr profile. You can also view our portfolio to explore our past work and design quality.
Frequently Asked Questions
1. Can I use Format Painter in PowerPoint for Mac or the web?
Yes, Format Painter is available in both. Mac users will find it in the same Home tab. In the web version, it’s also present, but some formatting (like certain effects) might not carry over.
2. Does Format Painter work across different presentations?
Yes. You can copy formatting from a shape in one PowerPoint file and apply it to another, using either the paintbrush tool or the keyboard shortcuts.
3. Can I copy animations using Format Painter?
No. Use the Animation Painter found in the Animations tab to duplicate animation sequences.
4. Can I apply formatting to grouped objects?
Sometimes. You can format the group as a whole, but Format Painter doesn’t always apply styles to each item inside consistently. Ungrouping before formatting may give better results.
5. How do I undo a formatting mistake?
Press Ctrl + Z immediately after using Format Painter to revert to the previous formatting.
6. What if I only want to copy fill color or font style?
Format Painter copies all visible formatting. If you want to selectively copy attributes (e.g. fill only), you’ll need third-party tools like PPT Productivity, which provide advanced options for choosing what gets copied.
7. Can Format Painter copy hyperlinks?
No. If you apply Format Painter to hyperlinked text, the link is removed unless you manually add it back.
8. Does Format Painter work on charts?
Partially. It may carry over chart font styles and colors but won’t copy entire chart templates or data label positions. Use the Chart Tools > Format tab for more granular control.
9. Can I use Format Painter on slide masters?
Yes, but only on placeholder styles. Use Slide Master View to edit formatting across all layouts and maintain consistency throughout your deck.